
Articles / Product Pages and Offers
What belongs above the fold on a product detail page?
What we found
The first screen should show the right product, the price and how to buy. Adding more often lost: a bigger gallery cost 8.0% of conversion, and showing the price sooner cut revenue per visitor 27.5%.
The first screen of a product detail page has 3 jobs. It has to show shoppers they found the right product, tell them roughly what it costs, and show them how to buy. Everything else can wait for the scroll.
That sounds simple, and it is easy to get wrong in both directions. In our A/B tests, pushing more onto the first screen often lost. A bigger gallery cost 8.0% of desktop conversion. Showing the price sooner cut revenue per visitor 27.5%. A tidier info order started strong and faded. Below is what those 3 tests show, and a checklist for mobile and desktop.
The first screen answers 3 questions
Above the fold is whatever a shopper sees before they scroll. On a phone that is often just the main image, the product name and part of the price. On desktop it usually adds the buy box: options, price and the add to cart button.
Shoppers do scroll. Nielsen Norman Group found that people now spend a little over half their viewing time above the fold, down from 80% in 2010. So the first screen does not need to hold everything. It needs to hold what makes a shopper keep going:
- Is this the right product? A clear main image, the product name and the star rating.
- What does it cost? The price, or a clear path to it.
- How do I buy? The option picker and a buy button that says what happens next.
When I review a product page, I start by asking what each element on the first screen is doing for 1 of those 3 questions. Anything that answers none of them is a candidate to move down.
Shoppers spent more when the price stayed in the option menu, by 27.5%
On 1 store, the product page showed the price only inside the option dropdown. That looked like a gap, so we tested 3 versions that showed the price on the page: next to the options, above the delivery date, and above the delivery date with the pay later message moved next to it.
Shoppers preferred the original. With the price above the delivery date, conversion held about even, up 1.6%, but revenue per visitor fell 27.5% over 14 days. Average order value dropped about 29%. About as many people bought, and they spent much less.
Evidence · Product page · Lost
Does showing the price earlier on the product page lift conversion?
14 days · responsive · We showed the price on the page, not just in the variant dropdown.
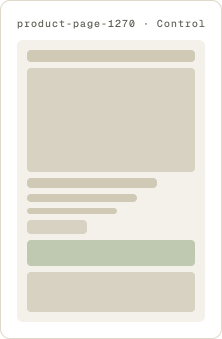
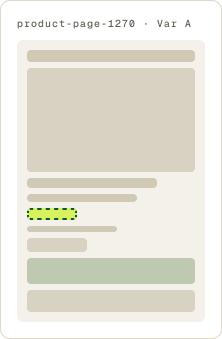
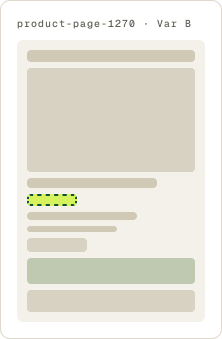
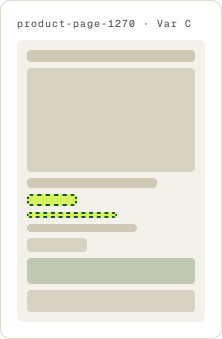
+1.6% conversion, -27.5% revenue per visitor
Read the full testSeeing a single price early seems to have anchored shoppers on the smallest option. When the price lived inside the option menu, shoppers saw it next to each size, after they had started choosing. Traffic on this test was low, so the size of the drop is less certain than its direction. The lesson still holds: where the price appears changes what people buy, not only whether they buy.
So do not treat “price above the fold” as a rule. If your products come in sizes or bundles, test the price beside the options as well as near the title.
Shoppers preferred the smaller gallery on desktop, by 8.0%
Bigger images feel like a safe bet on a visual product. On another store, the secondary images in the desktop gallery were small, so we made them larger to give shoppers a better look.
Shoppers preferred the smaller gallery. Conversion fell 8.0% and revenue per visitor fell 12.2% over 13 days. Every measure we tracked was down at the review, so we paused the test early.
Evidence · Product page · Lost
Do larger gallery images lift desktop product page conversion?
13 days · desktop · We made the secondary images in the desktop gallery larger.

-8.0% conversion, -12.2% revenue per visitor
Read the full testThe larger gallery pushed the product details further down the page. Shoppers on this page came to read: counts, details and options. When that content dropped lower, it got harder to reach, and fewer people bought. The follow-up test went the other way and looked for ways to save vertical space.
An 8.0% drop from a gallery change is a big move. That tells you the space on the first screen matters to these shoppers. It does not tell you images do not matter. It tells you the details they need cannot be pushed out of view to make room for them.
A cleaner info order faded from an early lift to 3.3% behind
The third test tried to fix the order of the first screen itself. The page mixed its key details with an animation and extra messages. We stopped the animation, hid star ratings on products with no reviews, removed a shipping message, and put the page in this order: image, star ratings, title, price, then copy. The branding stayed the same.
The cleanup showed strong lifts in its first week, so we let it run. Over the next weeks the gains leveled out, and after 20 days conversion finished 3.3% behind the original. The result never reached our confidence bar, and we paused the test.
Evidence · Product page · Not significant
Does a product page cleanup with a new info order lift conversion?
20 days · responsive · We reordered the product details and removed clutter from the page.

-3.3% conversion
Read the full testA tidier page is not the same as a better one. Shoppers on this store were already finding what they needed, and a reordered layout did not give them anything new. The next round moved closer to the purchase itself and tested which buying option was selected by default.
The early lift is worth a note, too. A new layout can look like a winner in week 1 just because it is new. This is why I want at least 2 full weeks of data before calling a test.
The buy button carries the most weight
If the 3 tests above say “be careful what you add,” the buy button is where a change can pay off. On 1 store, the product page button said shop now, and the header had its own shop now link. We changed the button to buy now and removed the header link. Conversion rose 59.3% and revenue per visitor rose 109.4% over 22 days (see the test).
Shop now on a product page asks shoppers to keep browsing. Buy now tells them exactly what happens next. We cover button wording, color and placement in What makes an add to cart button convert?
A big move tells you the element matters
When a test moves the number a lot, in either direction, shoppers care about that element. The 8.0% gallery loss and the 27.5% revenue drop both point to the same thing: what sits on the first screen changes what people buy. The next test tries 2 different directions on that element.
An above the fold checklist for mobile and desktop
Use this to audit your first screen before you test anything.
On mobile
- Main image sized so the product name and price start to show without a scroll.
- Product name and star rating directly under the image.
- Price visible, or the option picker with prices in it, within the first scroll.
- A buy button within easy reach. If it scrolls away early, test a sticky bar.
- No animations, banners or pop-ups covering the product.
On desktop
- Gallery and buy box side by side, both in view.
- Gallery sized so it does not push options and details below the fold.
- Price placed where shoppers make their choice. If you sell sizes or bundles, test it beside the options.
- Delivery timing near the buy button.
- 1 clear buy button, with no competing shop links in the header.
What can move below the fold
- Long descriptions, specs and care details.
- Full reviews. Keep the rating summary up top.
- Brand story, value props and trust badges, unless research shows a specific doubt they answer.
- Related products and cross-sells.
For the rest of the product page, including images, value props and trust badges, see Shopify product page optimization: 6 steps from real A/B tests
The first screen is not for everything. It is for the right product, the price and the next step.
Eyetracking research found users spent 57% of their viewing time above the fold in 2018, down from 80% in 2010. The authors advise reserving the top of the page for high-priority content and key goals.
Therese Fessenden 2018 · www.nngroup.com ↗
Our tests agree that the first screen should hold only what matters most. Crowding it with a bigger gallery or an early price cost conversion or revenue.
Frequently asked questions
What should be above the fold on a product page?
The main image, product name, star rating, price or option picker, and a clear buy button. Those answer whether this is the right product, what it costs and how to buy. Details, full reviews and cross-sells can sit below.
Should the add to cart button be above the fold on mobile?
It should be easy to reach. On many phones the button falls just below the first screen, which is fine if shoppers can find it fast. If long pages push it away early, test a sticky add to cart bar.
How big should product images be?
Big enough to show the product clearly, but not so big that they push the details shoppers need out of view. In our test, larger desktop gallery images cut conversion 8.0% because they pushed product content down.
Where should the price go on a product page?
Where shoppers make their choice. In 1 test, showing the price earlier on the page held conversion even but cut revenue per visitor 27.5%. If you sell sizes or bundles, test the price beside the options.
What are common product page mistakes?
Crowding the first screen, oversized galleries that bury key details, animations that compete with the product, and vague buttons like shop now. In 1 test, changing shop now to buy now lifted conversion 59.3%.
The evidence
The 3 tests this article leans on
Evidence · Product page · Lost
Does showing the price earlier on the product page lift conversion?
+1.6% conversion, -27.5% revenue per visitor
Read the full testEvidence · Product page · Lost
Do larger gallery images lift desktop product page conversion?
-8.0% conversion, -12.2% revenue per visitor
Read the full testEvidence · Product page · Not significant
Does a product page cleanup with a new info order lift conversion?
-3.3% conversion
Read the full test