
Does a product recommendation table lift review article clicks?
Our review article listed its top picks as a standard product list. We tested a table layout labeled with the current year, to make the review easier to scan and trust. Click-through fell 6.4%, and we paused the test after 13 days.
Lost Responsive 13 days Called at 90%
The hypothesis
By presenting the picks in a table labeled with the current year, we will make the review easier to follow and trust, resulting in more product clicks and revenue.
Visitors on review articles want to know the picks are current and that real work went into them. A table with the year in it could make the review process feel more open and up to date.
The page already listed each product in its own section, so a table was a way to show all of the picks at a glance.
What we changed
Top picks shown as a table labeled with the current year
On the control, the top picks appeared as a standard list, with each product in its own block. In the variation, the picks were grouped into a table, and the table was labeled with the current year to show the review was up to date. The rest of the article stayed the same.
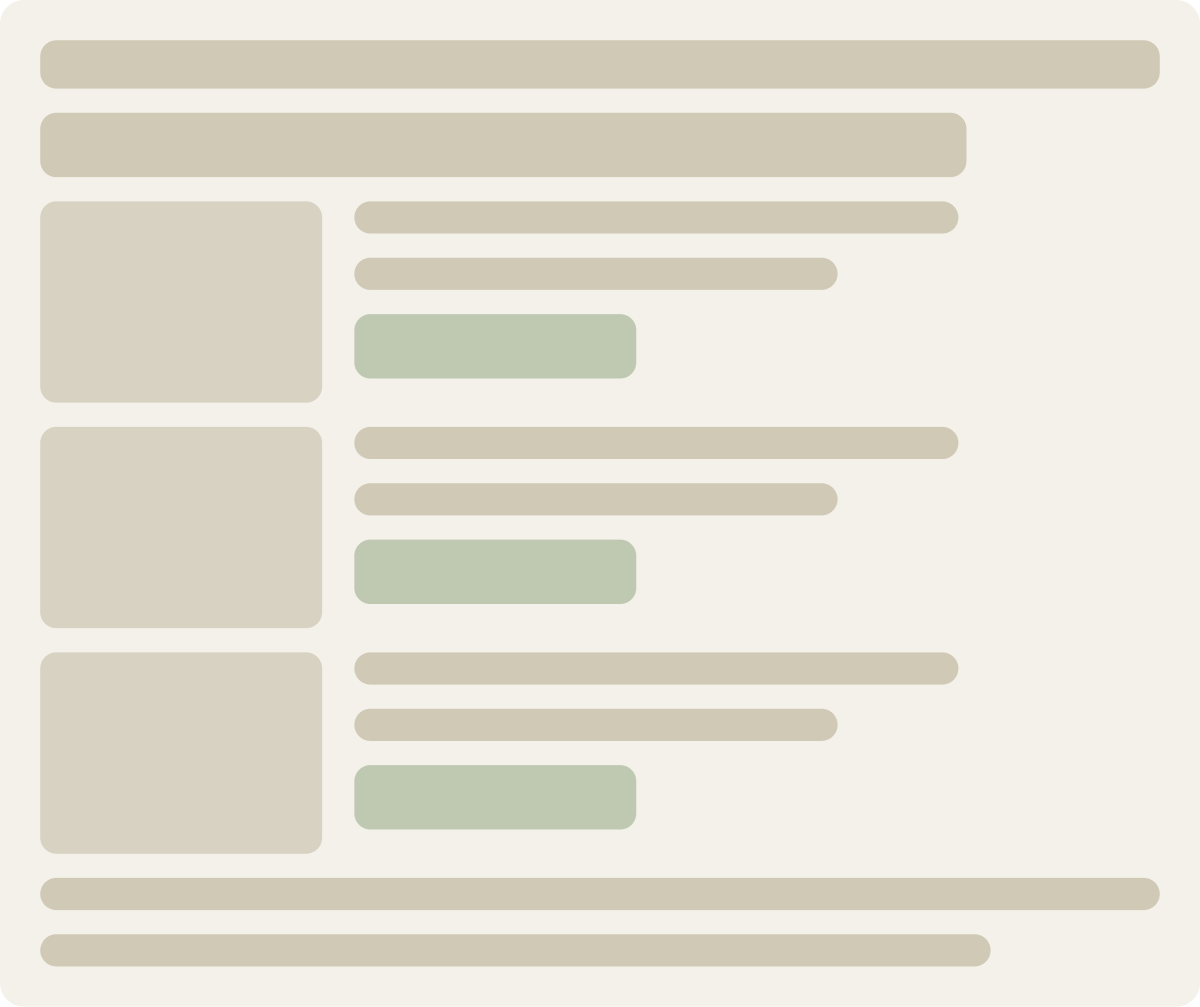
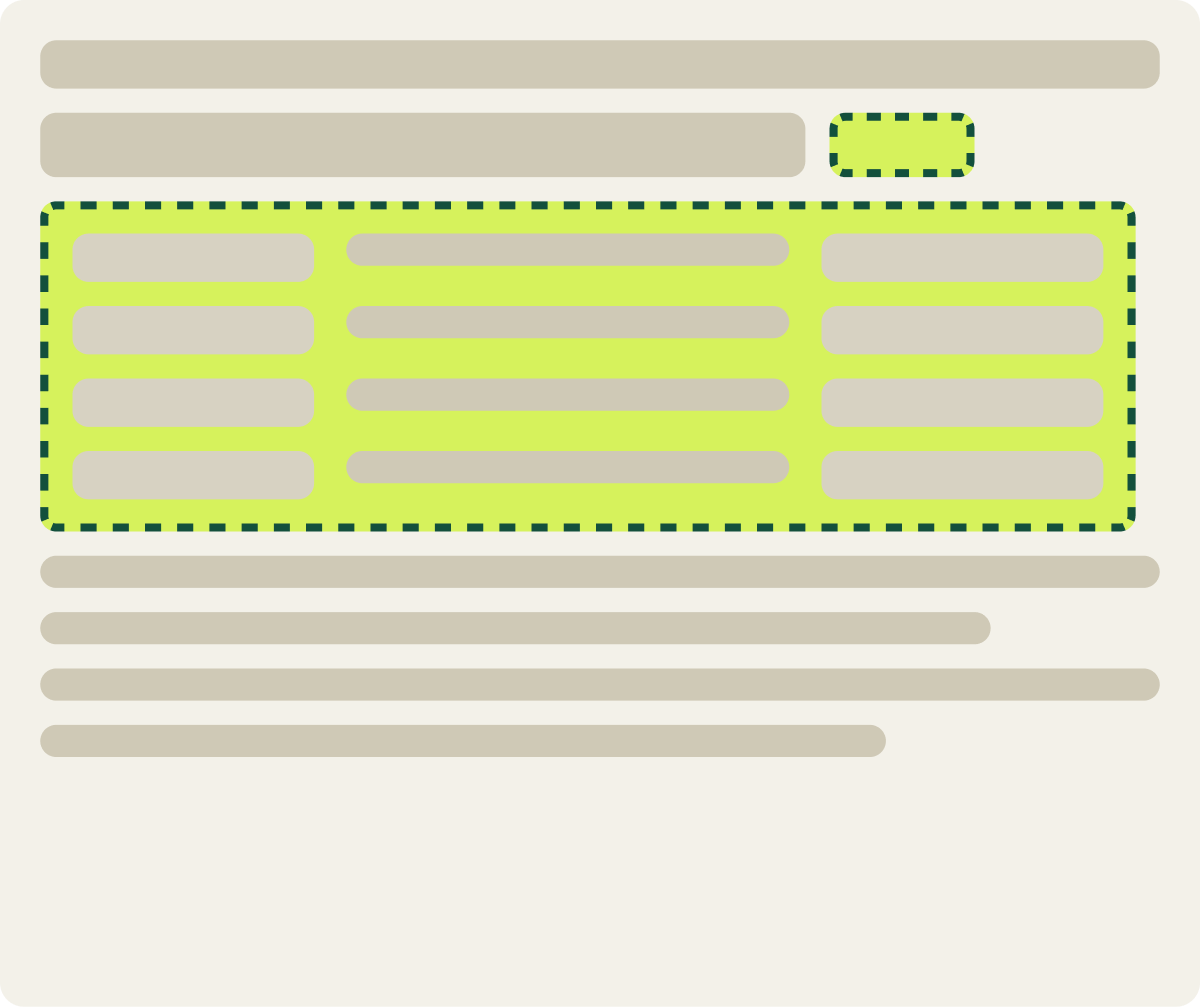
- Top picks grouped into a single table
- Table labeled with the current year
- Rest of the article unchanged
The result
Visitors preferred the original list, by 6.4% in click-through
Click-through to the retailer was 6.4% lower with the table. The primary metric for this test was click-through.
We paused the test at 13 days because click-through showed no sign of a lift, and each extra day cost clicks. Revenue per visitor came in 11.4% higher for the table, but we judged the test on click-through.
What we took from it
Visitors clicked more from the original list than from a table
On this page, the separate product blocks gave each pick room to make its case, and visitors clicked through more from them. The table and year label did not add enough trust to make up for that. We paused the table and kept the original list.