
Test archive / Collection page
Does removing the hero image lift desktop collection page conversion?
The desktop collection page opened with a hero image above the products. We tested removing it, alone and with 3 larger products per row. Conversion rose 6.0% and revenue per visitor fell 11.7% over 19 days, and we implemented the change.
Do No Harm Desktop 19 days Called at 90% Reviewed
The hypothesis
By removing the hero image on desktop, as we did on mobile, we will bring products into view sooner, resulting in more conversions with revenue held steady.
Removing the hero image had shown positive movement on mobile. A denser desktop grid with 5 products per row had just lost, and shoppers seemed to want larger images and less distraction.
We wanted to roll the mobile change out to desktop too, as long as it did no harm.
Removing the image on desktop must be revenue neutral against the control.
A do no harm test is not trying to win. It is judged against the criterion above, and is never counted toward the win rate.
What we changed
We removed the hero image from the desktop collection page.
Variation A removed the hero image at the top of the page. Variation B removed the image and showed 3 larger products per row. We paused Variation B partway through to send more traffic to the control and Variation A.

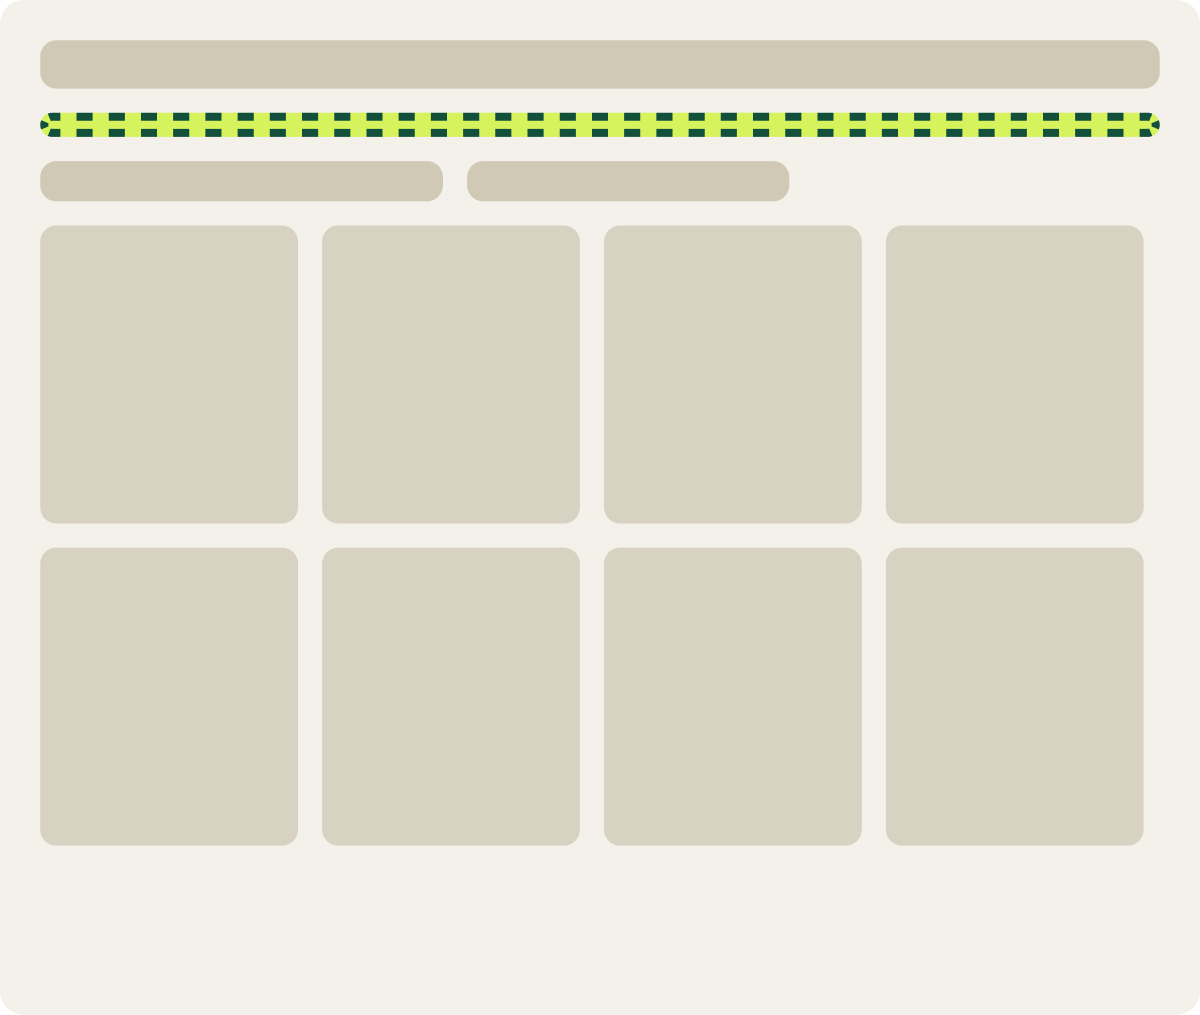
- Hero image removed from the top
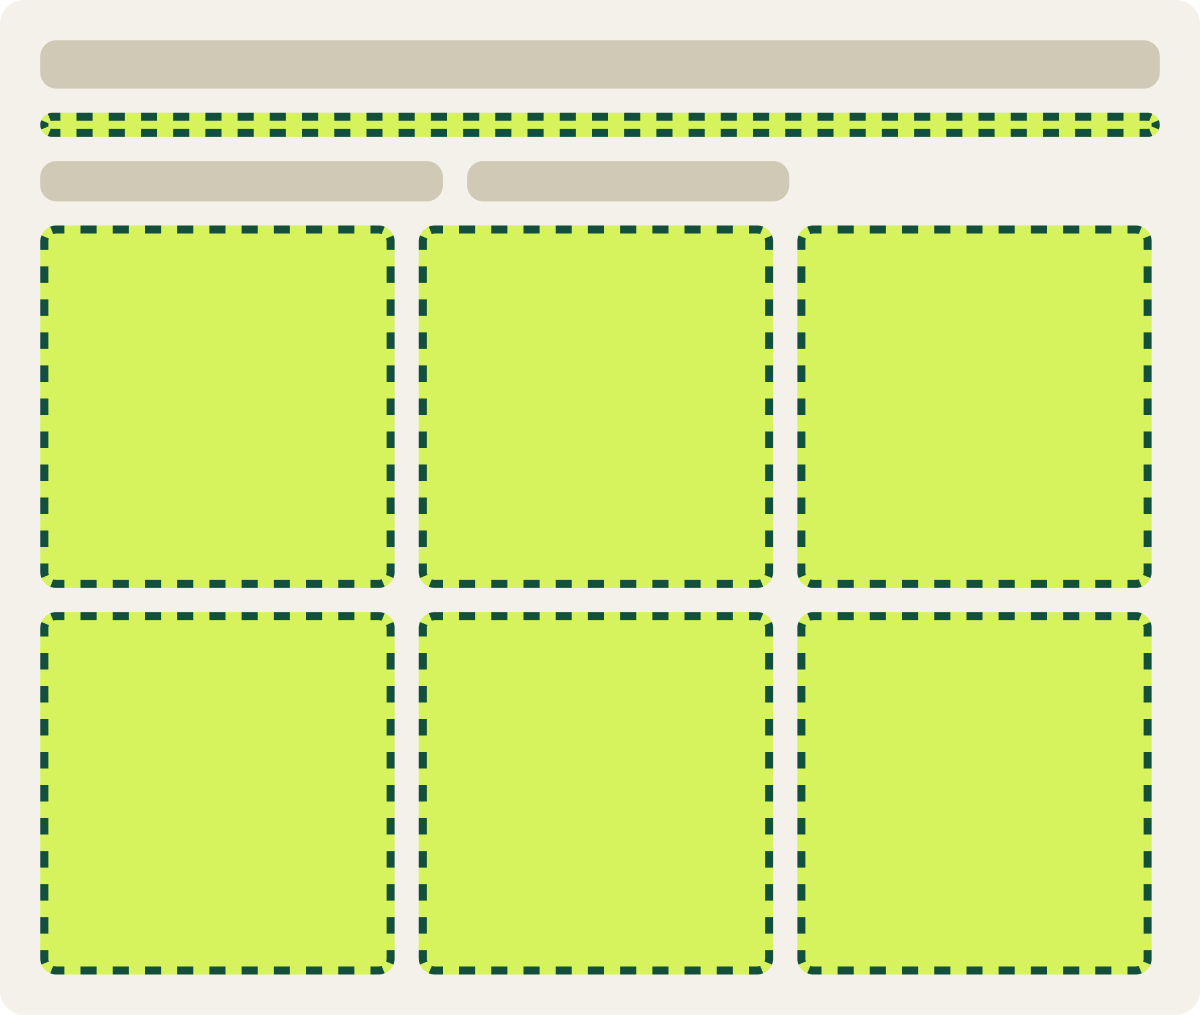
- Hero image removed from the top
- 3 larger products per row
- Paused partway through the test
The result
Conversion rose 6.0% and revenue per visitor fell 11.7% over 19 days.
Conversion rose 6.0%, but revenue per visitor fell 11.7%, short of the revenue neutral goal. Shoppers who bought spent about 17% less. Variation A improved week over week.
We ended the test at 19 days when our analytics platform changed over. We implemented the change on mobile and desktop.
What we took from it
More shoppers bought, but each order was smaller.
With the hero gone, shoppers reached products faster and more of them bought. The drop in revenue per visitor came from smaller orders, so the change missed its revenue goal on this page. We implemented it to keep the layout the same across mobile and desktop.